
The Chart Is Revealing a Major Shift Ahead
📅 20 September 2026 • 36 min read • BTC technical analysis
📑 Table of Contents
- The Whispers of a New Regime
- Bitcoin Price Prediction Today – Market Structure
- Accumulation Range: Why the Chart Is Signaling a Shift
- Bullish Scenario – The Continuation Case
- Bearish Scenario – The Distribution Threat
- Ethereum Analysis – ETH/BTC Relative Strength
- Bitcoin Dominance – The Rotation Signal
- Gold, Dollar, and Macro – The Global Risk Gauge
- Whale Accumulation and On‑Chain Themes
- What Traders Are Watching Right Now
- People Also Ask – Direct Answers
- Frequently Asked Questions
- Related Analysis
- Conclusion – Reading the Shift Without Chasing It
⚡ The Whispers of a New Regime
Every major move in Bitcoin's history began the same way: quietly. The transition from bearish to bullish almost never arrives with a trumpet — it builds beneath the surface, inside ranges that look boring to the untrained eye and like opportunity to those who can read them. The chart is whispering that something is changing now.
The evidence is subtle, which is exactly how it works. A range that refuses to break down. Support that keeps getting defended by invisible buyers. Volume that dries up on dips and returns on recoveries. Supply that quietly moves off exchanges while the crowd watches the same price day after day. These are not coincidences. They are the fingerprints of an accumulation range — the structure that typically precedes the most significant upswings in the market's history.
But the whisper is not a command. The range could still resolve the other way. What the chart is revealing is not certainty — it is a shift in probabilities, a rotation in the underlying composition of the market. The traders who recognize what is building are the ones who will be positioned when the regime finally announces itself. The question is not whether the chart speaks. It is whether you have learned to listen.
📈 Bitcoin Price Prediction Today – Market Structure
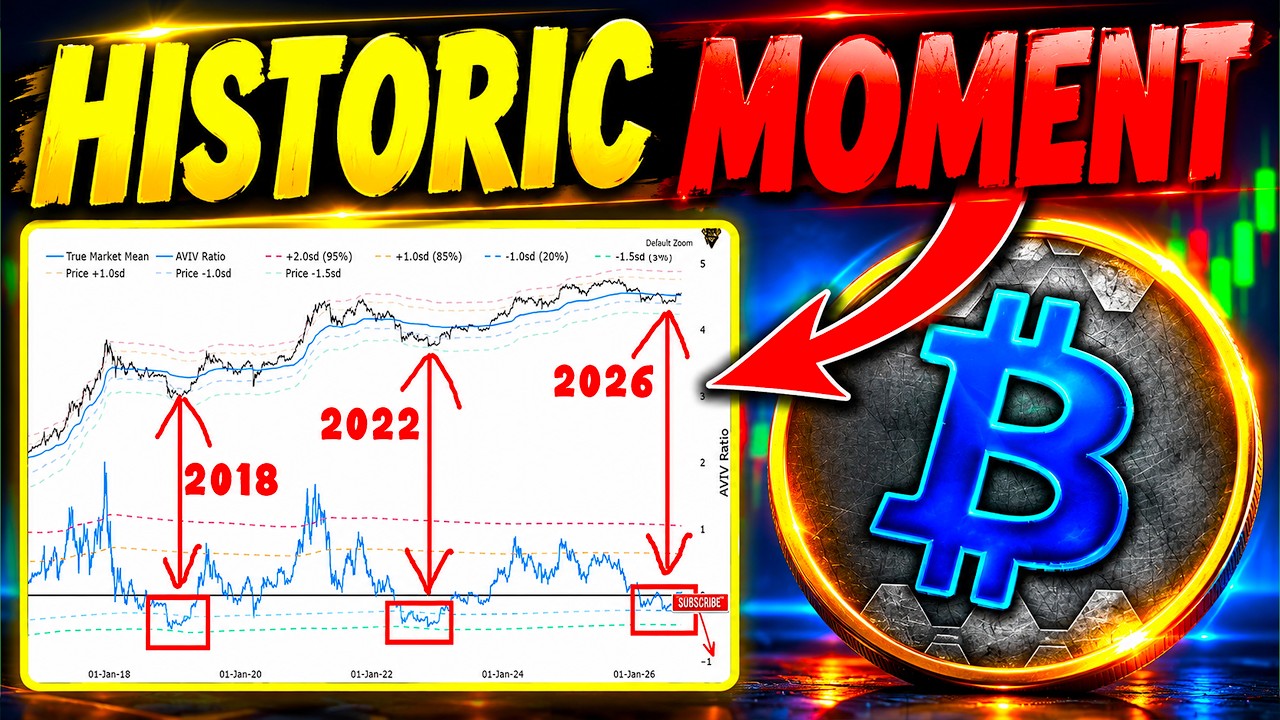
The daily Bitcoin chart is displaying a structure that has appeared at the base of almost every major rally in the asset's history: a wide, resilient range where price repeatedly fails to break lower even when the macro environment gives it every reason to. The current structure is a textbook accumulation range in its late stages.
Trend direction remains ambiguous at the surface. Price has been carving a series of roughly equal highs and higher lows — a consolidation that leans mildly constructive on the weekly timeframe even as the daily structure looks neutral. What distinguishes the current setup from a simple pause is the character of the buying at support. Each test of the lower boundary has been met with a sharper recovery than the last, and the recovery volume has been noticeably stronger than the selling volume that preceded it.
Momentum analysis reflects that quiet improvement. The oscillators, while still in neutral territory, are traceably making higher lows — a subtle but persistent signal that downside pressure is losing force. This is the kind of shift that rarely shows up in a headline but consistently shows up before major moves. Volatility compression continues, with the trading bands tightening around the range, and the combination of rising underlying momentum and falling realized volatility is historically significant.
Liquidity dynamics reinforce the accumulation thesis. The range has built liquidity pockets above and below, but the structure of those pockets is telling: the downside liquidity has been repeatedly harvested — swept, filtered, and absorbed — while the upside liquidity remains intact and untouched. In market terms, that is a structure that has been patiently engineered to exhaust sellers before attracting the next wave of buyers.
🛡️ STRONG SUPPORT ZONE
⚡ KEY RESISTANCE AREA
💠 ACCUMULATION RANGE
None of this guarantees the breakout. An accumulation range can fail — the breakdown is always on the table until the shift confirms. But the structure is now such that the path of least resistance, if it does resolve, is becoming visible. The key levels are clear, the framework is defined, and the discipline is to wait for the range to make the decision.
🧩 Accumulation Range: Why the Chart Is Signaling a Shift
The unique angle in today's analysis is the accumulation range — the specific shape of consolidation that historically marks the transfer of supply from weak hands to strong hands. The chart is not just showing a pause. It is showing a process, and that process is what defines the potential shift ahead.
An accumulation range differs from ordinary consolidation in its internal character. Ordinary consolidation is driven by indecision. Accumulation ranges are driven by intent. The distinguishing features include:
- Asymmetric volume: Dips attract above-average buying while rallies to the range top draw below-average selling. Volume distribution reveals who is absorbing the supply.
- Support hardening: Each test of the support zone produces a faster and more decisive recovery. The lower boundary is being "repaired" — reinforced by anyone repeatedly willing to buy it.
- Liquidity harvesting below: The liquidity pools beneath the range have been repeatedly triggered and absorbed. Downside fuel has been spent; upside fuel remains.
- Exchange supply dynamics: On-chain flows show coins persistently leaving liquid exchange wallets for storage — the signature of buyers accumulating rather than sellers distributing.
- Improving resilience: The market increasingly ignores bearish macro headlines, a hallmark of a maturing accumulation phase where supply is already locked away by committed holders.
The importance of recognizing an accumulation range lies in what it implies about the eventual resolution. When supply has been absorbed at these depths, the market can only stay in the range for so long before it forces upside expansion — because there is no more supply left to sell into the range. The range becomes self-resolving once the transfer of coins is complete.
This is the "major shift" the chart is revealing. Not a guarantee of direction, but a structural bias: the range is shaped like a mechanism designed to deliver the market to the upside break. The open question is timing — and timing, in a compressed range, is always the last thing to confirm.
The flip side carries equal weight in the honest analyst's framework. If the range fails — if the support zone finally gives way under sustained selling — then what looked like accumulation would be unmasked as something else. The two-sided discipline is what separates reading the chart from praying at it. The bias leans constructive, but the invalidation level is absolute.
🐂 BULLISH SCENARIO – THE CONTINUATION CASE
- Trigger: Daily close above the key resistance area on expanding volume
- Confirmation: The broken resistance reclaims as support on the retest
- Structure: Range exit with momentum and volume alignment across timeframes
- First target: The next major supply zone above the range with its own liquidity pool
- Invalidation: Failure to hold the breakout, price re-enters the range
🐻 BEARISH SCENARIO – THE DISTRIBUTION THREAT
- Trigger: Daily close below the strong support zone with increasing downside volume
- Confirmation: Selling persists through retests of the broken support
- Structure: Breakdown exposing the deeper demand area and liquidity pocket below
- Signal: Rising Bitcoin dominance with broad altcoin weakness — defensive rotation
- Invalidation: Quick reclaim of the support zone signaling a failed distribution
🐂 Bullish Scenario – The Continuation Case
The bullish scenario is the natural resolution of an accumulation range: a decisive break above the key resistance area on meaningful volume, followed by confirmation that the level now holds as support. The sharper the volume expansion on the break, the more credible the shift.
Several conditions would strengthen the continuation case. Momentum alignment across the daily and four-hour timeframes is essential — a bullish crossover in both removes the ambiguity that has kept the range alive. Sentiment is equally important: the flow of stablecoin reserves into the market — the deployment of dry powder — would confirm that the breakout is backed by real capital rather than thin order books. And breadth matters: participation from Ethereum and the broader altcoin complex converts a Bitcoin move into a market-wide regime shift.
The first target in this scenario is the next major supply zone above the current range. A clean break through the resistance area should carry the momentum to at least probe that zone within the first sessions. A successful test of the second target — the liquidity pool beyond — would mark the shift as structural rather than tactical.
Invalidation remains a single, traceable event: the failure to hold above the broken resistance. If price breaks the level, then immediately prints inside the range again, the move was a sweep — a final test of the accumulated liquidity above before the range resolves elsewhere. The bullish case survives only as long as the level holds.
🐻 Bearish Scenario – The Distribution Threat
The bearish scenario is the mirror image of the accumulation thesis: what looks like absorption could instead be distribution — the slow, disguised release of supply into a market that believes it is accumulating. Every accumulation range has this shadow, and honest analysis holds both possibilities open.
The signal that would flip the interpretation is a breakdown of the strong support zone on real volume. In a true distribution structure, the breakdown is not sharp — it is gradual, characterized by a series of failed rallies and a persistent leak of selling pressure. The giveaway is the character of the rejections: if rally attempts at the resistance area begin producing lower highs, the range's internal neutrality is breaking down in favor of sellers.
A risk-off environment would accelerate the bearish case. Rising Bitcoin dominance combined with broad altcoin weakness signals defensive rotation — capital moving toward the relative safety of Bitcoin as the market de-risks. If the macro backdrop simultaneously sours — a firmer dollar, falling equity risk appetite — the distribution scenario gains real traction.
The first targets in this scenario are the deeper demand areas beneath the current support zone. In a genuine breakdown, the initial demand area often fails to hold cleanly because the market's confidence has already cracked. The invalidation of the bearish case is equally clear: a quick, decisive reclaim of the support zone, which would flag the breakdown as a liquidity sweep rather than a regime change.
🔷 Ethereum Analysis – ETH/BTC Relative Strength
Ethereum's position in the current structure acts as a truth-teller for the accumulation thesis. If Bitcoin is genuinely in an accumulation range, Ethereum's technical setup should reflect the same behavior — and true participation from the altcoin complex on a breakout is what separates a shift in the whole market from a rotation confined to one asset.
The ETH/BTC ratio has been building its own base below a declining resistance trendline. The compression in the ratio mirrors the compression in Bitcoin, and the resolution of the two structures is deeply interconnected. A breakout in ETH/BTC would confirm that altcoin capital is returning — the signature of a broad, risk-on regime. A breakdown would confirm the opposite: capital rotating into Bitcoin, a defensive posture that historically precedes altcoin underperformance.
Fundamentally, Ethereum retains the institutional interest and development pipeline that anchor its medium-term outlook. But in the immediate structure, the technical picture dominates. Ethereum has historically been the amplifier of Bitcoin's moves — when Bitcoin commits, ETH tends to extend further in both directions. That amplification is precisely what traders look for in confirmation: a Bitcoin breakout that Ethereum follows with equal or greater conviction is a breakout with breadth and staying power.
Watch the ETH/BTC pair at the range boundaries as the primary altcoin confirmation signal. Its first decisive move after Bitcoin's range resolves will tell you whether the shift is broad or narrow — and whether the emerging regime is one that sustains rallies or fades them.
For a deeper look at the altcoin technical picture, visit our crypto market analysis coverage.
📊 Bitcoin Dominance – The Rotation Signal
Bitcoin dominance (BTC.D) is the metronome of the altcoin market, and its current structure holds an important clue about the regime shift. Dominance has been trading within its own range, neither breaking to new highs nor resolving lower — a mirror of Bitcoin's own consolidation and a sign that the market is collectively waiting for direction.
The scenarios branching from dominance are clean and well understood. A break higher in BTC.D signals defensive rotation — capital seeking Bitcoin's relative stability while the altcoin complex loses altitude. A break lower signals constructive rotation — capital flowing into altcoins as risk appetite expands. In the accumulation context, a dominance decline during a Bitcoin breakout would be the more bullish outcome, because it indicates breadth: a distributed rally that carries the entire market higher.
The altcoin implications of the dominance resolution are direct. Ethereum, Solana, and XRP — the other majors in daily focus — all respond to shifts in BTC.D. When dominance compresses, the suppressed altcoins are the first to spring once the lid comes off. This is why dominance is watched so closely during range-bound periods: it is not just a metric, it is a leading indicator of where the market's rotation will land when the range finally breaks.
Traders should treat BTC.D as a confirmation filter. If Bitcoin breaks out and dominance confirms the direction of the move, the signal is structurally sound. If the two contradict each other, the move is suspect until it resolves — and the odds of a fakeout climb. When accumulation and rotation confirm each other, the probabilities shift meaningfully.
🥇 Gold, Dollar, and Macro – The Global Risk Gauge
Gold is coiling in a structure remarkably parallel to Bitcoin's, and the convergence is not accidental. Both assets are sensitive to the same macro currents: dollar direction, real yields, and the ebbs and flows of global risk appetite. When their compressions align, the resolution tends to arrive under the influence of a shared catalyst.
Gold has been consolidating below a key resistance area, building the same kind of internal strength that Bitcoin's range displays — consistent buying of dips with limited selling pressure at the highs. The correlation between the assets has strengthened through periods of macro uncertainty, and both currently sit at decision zones. A coordinated breakout in gold and Bitcoin would signal that the shift is macro-driven — and therefore more durable than a move confined to crypto-specific flows.
The dollar remains the central pivot. A softer dollar supports both gold and Bitcoin by reducing the opportunity cost of holding non-yielding assets. A firmer dollar does the opposite, pressing on the risk appetite that sustains crypto rallies. The dollar's current structure is contested, oscillating without clear direction — and this ambiguity is itself one of the forces keeping the crypto range intact.
Equity sentiment is the third leg of the macro tripod. Risk-on sentiment in equities tends to feed crypto optimism, while risk-off episodes accelerate defensive rotation. The equity indices are themselves compressing near key levels, and their resolution will likely coincide with the crypto resolution. If macro triggers a coordinated shift — lower dollar, firmer gold, resilient equities — Bitcoin's accumulation range would have its catalyst. If the macro backdrop sours instead, the range resolves lower with conviction.
For an expanded view of the macro environment and its influence on the market, see our Gold XAUUSD analysis.
🐋 Whale Accumulation and On‑Chain Themes
On-chain data is where the accumulation thesis finds its most concrete support. The web of wallet behavior, exchange flows, and holder activity tells a consistent story about who is collecting the supply being offered into the range:
- Exchange outflows: Coins are persistently moving off exchanges into custody. This is the purest on-chain expression of accumulation during a range — removing sellable supply from the liquid market.
- Long-term holder supply: The share held by long-duration cohorts remains elevated. These holders have historically been on the correct side of the market's largest regime changes, and their commitment is a quiet vote for the medium-term outlook.
- Stablecoin reserves: Ample stablecoin balances on exchanges represent dry powder. When a breakout confirms, the deployment of these reserves typically accelerates — adding fuel to the early stage of a new leg.
- Miner positioning: Mining cohorts continue to hold rather than sell into the range. Restrained minelayer supply is a supportive — though occasionally temporary — dynamic.
- Supply dynamics: The circulating supply available for trading is measurably thinning at the boundaries of the range, consistent with a phase of quiet absorption rather than distribution.
Read together, these themes describe a market where the transfer of supply is happening in the direction of committed holders. That is the textbook definition of an accumulation range in progress. It does not mean the breakout is imminent — accumulation can persist for extended periods — but it does define the bias of the market's most informed participants.
The honest caveat remains: on-chain data confirms the composition of the market, but it cannot time the resolution. Whales sometimes accumulate too early, and ranges sometimes break in the opposite direction. Use the on-chain picture as a bias filter, wait for the technical confirmation, and let the structure — not the hope — determine the entry.
👀 What Traders Are Watching Right Now
The compression at the top of the accumulation range has focused the entire market on the same outputs. When a structure this mature resolves, the follow-through — or the failure — happens quickly. Here is what is drawing the most attention:
- Volume behavior on rallies: Whether the next push at the resistance area arrives on expanding volume — the difference between a real exit and another range test.
- The retest: How price handles the return visit to the resistance area after a break — holding it as support confirms the shift.
- Daily close position: Intraday excursions matter little; the daily close beyond the range is the entry ticket to a structural read.
- Momentum divergences: Whether the oscillators print fresh higher lows at support — the internal evidence that selling pressure is exhausting.
- Dominance direction: Whether BTC.D confirms or contradicts the emerging move.
- ETH/BTC resolution: Ethereum's relative performance during the first push determines whether the shift carries breadth.
- Liquidity zone behavior: Watching the pools above resistance for a sweep-and-reverse — or proper absorption — helps separate fakeouts from genuine breaks.
- Macro triggers: Dollar moves, gold breakouts, and equity reactions that could supply the catalyst — or the counter-force — to the range resolution.
💡 People Also Ask – Direct Answers
Bitcoin consolidates when buyers and sellers reach temporary equilibrium, typically during macro uncertainty or ahead of a major catalyst. Prolonged consolidation builds an accumulation range where supply is absorbed and liquidity pools form on both sides. Historically, the longer the consolidation, the larger the directional move that eventually resolves it.
Bitcoin breakouts are triggered by a shift in supply and demand — macro news, ETF flows, sentiment changes, or the completion of a technical pattern. In an accumulation range, the breakout often follows the exhaustion of sellable supply: once the sellers inside the range disappear, price expands upward to attract the demand that has been waiting.
A liquidity sweep occurs when price moves beyond a key level to trigger clustered stop-losses and liquidation orders, then reverses. Large participants use sweeps to fill positions efficiently. Sweeps are common at range boundaries and frequently disguise themselves as breakouts — which is why confirmation matters before acting on the first move.
Bitcoin is drawn to liquidity because large participants need depth to enter and exit positions without excessive slippage. Price therefore tends to move toward concentrated pools of orders — stop-loss clusters, liquidation zones, and pending entries. This is why moves often extend just beyond visible levels before continuing or reversing.
Yes. Sudden reversals after false moves are common in crypto, especially at range boundaries. For this reason, waiting for confirmation — a daily close beyond the level on real volume — is essential. Entering on the first push through a widely watched level is how traders get caught on the wrong side of a trap.
A genuine breakout combines a close beyond the level on the daily timeframe, expanding volume, a successful retest of the broken level, and momentum alignment. The absence of any one of these elements — especially volume — leaves the breakout unconfirmed and suspect.
Volume is the most important confirming signal in technical analysis. Breakouts without volume expansion tend to fail, and breakdowns without it tend to reverse. Volume also distinguishes accumulation from distribution — in an accumulation range, dips attract above-average volume while rallies draw below-average selling.
Whales control enough capital to influence market direction. Their accumulation and distribution patterns can foreshadow major moves, and their need for liquidity often drives the sweeps and fakeouts seen at range boundaries. Tracking whale behavior on-chain adds context that price action alone cannot provide.
❓ Frequently Asked Questions
An accumulation range is a consolidation pattern where supply is systematically transferred from weak hands to strong hands. It is characterized by defended support, asymmetric volume (buyers absorb dips), declining exchange supply, and improving resilience to bearish news. Accumulation ranges historically precede major upside moves.
Compare the volume character at the boundaries. In accumulation, dips draw above-average buying and rallies draw below-average selling — support hardens over time. In distribution, rallies lack traction, lower highs form, and exchange supply grows. On-chain flows are the clearest arbiter: outflows signal accumulation, inflows to exchanges signal distribution.
Accumulation ranges can last weeks or months. The duration is driven by how long it takes to transfer available supply. The range resolves when the supply inside it is exhausted — price then expands toward the side that reflects the imbalance. Duration alone is not a signal; the internal character is.
If the support zone fails on real volume, the accumulation thesis is invalidated and the structure re-reads as distribution. The fallout depends on the leverage built inside the range — crowded long positions can cascade as liquidations stack. The invalidation must be respected without hesitation.
Whale accumulation — the persistent removal of coins from exchanges into custody — is the on-chain signature of an accumulation range. When large wallets collect supply during a consolidation, they are positioning for a move higher. Whale behavior is a bias filter, not a timing signal.
Yes. In an accumulation range, dominance behavior confirms the character of the move. Falling dominance during a breakout signals broad participation — a healthier, more durable shift. Rising dominance signals defensive rotation, which favors Bitcoin but weights on altcoins.
They frequently overlap but are not identical. Accumulation describes the transfer of supply, which usually — though not always — occurs near price lows. A true bottom formation requires the accumulation to complete and the structure to break upward. Confirmation, again, is everything.
Subscribe to Thomas Boleto on YouTube for daily video analysis and join the Patreon community for VIP trade ideas, live market updates, and educational content. Follow the Bitcoin price prediction label for all published analysis.
📚 Related Analysis
Deepen your understanding of the current market structure with these related analyses:
- Bitcoin Price Prediction — Daily BTC technical analysis and market structure breakdowns.
- Crypto Market Analysis — Broader market coverage including Ethereum, Solana, and XRP.
- Gold XAUUSD Analysis — Gold's role as a macro risk barometer and its correlation with Bitcoin.
- Advanced Charts and Resources — Educational content on support, resistance, accumulation and distribution, and risk management.
📺 Live Market Analysis
🚀 Get Daily Bitcoin Analysis & VIP Trade Ideas
Join the private community for daily crypto market insights, educational trade ideas, technical analysis breakdowns, and exclusive live market updates.
Join Patreon →📌 Conclusion – Reading the Shift Without Chasing It
The chart is revealing a shift, but a shift is not a movement — it is a reorientation of probabilities. The accumulation range, the hardening support, the drained downside liquidity, and the quiet on-chain absorption all point in one direction: the market is being prepared for an upside resolution. The evidence is coherent and the structure is mature.
Yet the discipline of the analyst is to hold that bias without surrendering to it. The range can still break down. The level that matters — the support zone that has carried the accumulation — must hold for the constructive read to survive. Everything after that is confirmation work: volume, retests, momentum, dominance, and the breadth of the broader market's participation.
Patience is not passivity here. It is the deliberate refusal to chase the range's final moves and the readiness to act when the market commits. The traders who read the accumulation correctly are not the ones who buy the bottom — they are the ones who wait for the shift to confirm, and then position with the structure rather than against it.
Watch the levels. Respect the invalidation. Let the chart make the decision, and be ready for the move when it comes. Major shifts announce themselves to those who are paying attention — and the accumulation range has been announcing this one for some time.
For ongoing Bitcoin technical analysis and market updates, visit the Bitcoin price prediction label or explore our full crypto market analysis coverage.
📊 Deepen your understanding → thomasboleto.com for advanced charts and educational resources.
Risk Disclaimer: Cryptocurrency trading involves substantial risk of loss. Past performance is not indicative of future results. This content is for educational purposes only and does not constitute financial advice. Always do your own research and consult a qualified advisor before investing. Never risk more than you can afford to lose.


0 Comments